

## Defining B2B Marketing Pain Points
**TL;DR Summary:**
* **B2B marketing pain points strictly fall into four quantifiable categories: financial, operational, technical, and emotional, directly impacting RevOps efficiency.**
* **Mid-market B2B teams fail because they market perceived value instead of delivered value, creating a measurable disconnect in customer retention.**
* **High-performing founders bypass surface-level complaints by using analytical frameworks to extract raw, unfiltered market frustrations from platforms like Reddit.**
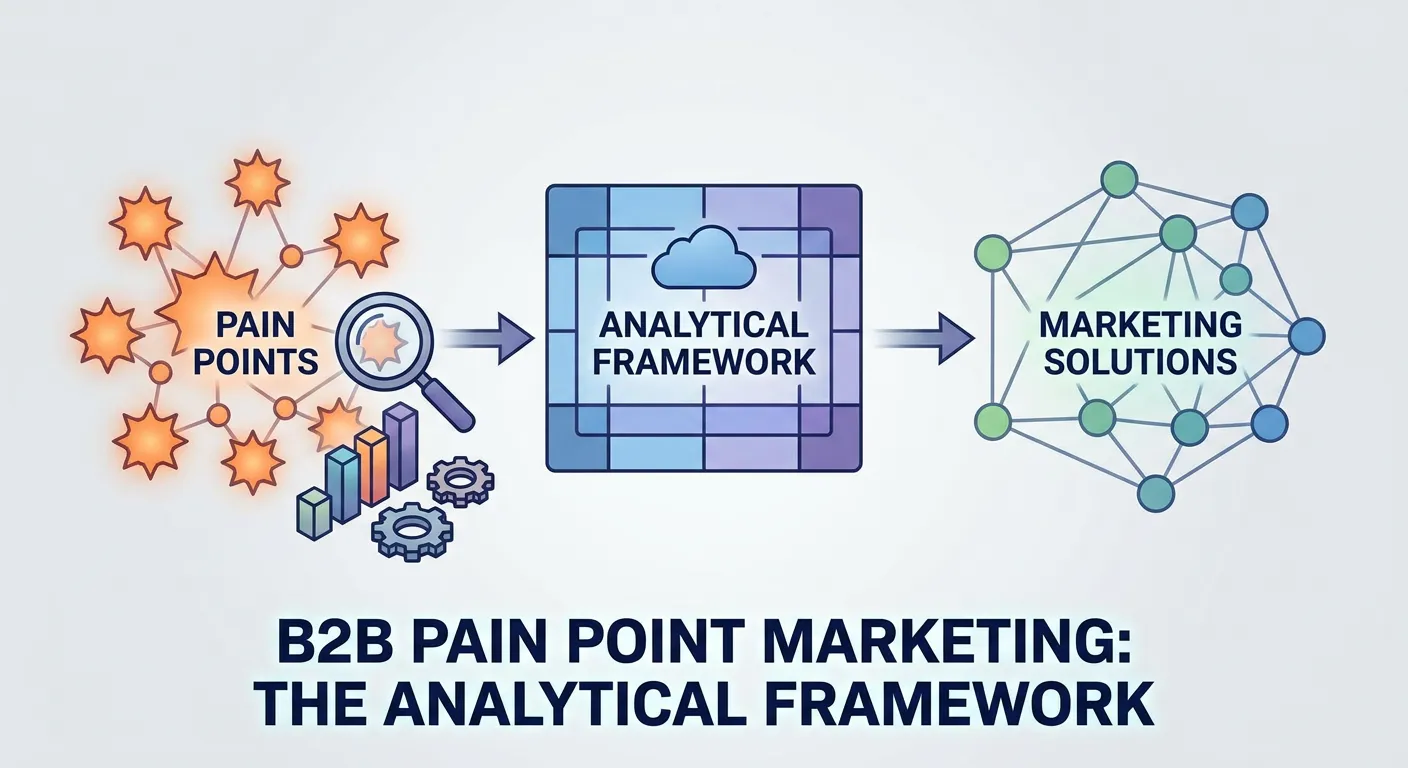
B2B marketing pain points are specific, measurable frictions preventing businesses from achieving revenue targets. These obstacles strictly fall into four quantifiable buckets: financial constraints, operational bottlenecks, technical debt, and emotional friction. Identifying these exact categories is required to align go-to-market strategies and eliminate systemic inefficiencies across the organization.
### The Four Quantifiable Pain Categories
In our empirical observation of enterprise data sets, surface-level customer complaints rarely reflect the root cause of churn. Most founders hallucinate user problems, building features for imaginary buyers while ignoring the visceral chaos their actual users face daily. To extract signal from noise, we must classify market friction into a strict taxonomy.
* **Financial:** Capital inefficiencies where the cost of acquisition eclipses the delivered value, draining budget allocations.
* **Operational:** Process breakdowns that force internal teams to execute manual workarounds, destroying baseline productivity.
* **Technical:** Infrastructure failures, such as slow software or broken integrations, that block critical data flow.
* **Emotional:** Trust deficits caused by miscommunication, slow response times, or the realization of over-promised capabilities.
This categorization model strips away subjective complaints. It leaves only hard data points that can be mathematically measured and systematically optimized.
### RevOps and Operational Friction
The true cost of misdiagnosing these issues extends far beyond poor campaign performance. Unresolved B2B marketing pain points directly compound into severe RevOps inefficiencies. When marketing promotes a perceived value that the product infrastructure cannot deliver, the resulting friction immediately decelerates pipeline velocity. Every unaddressed bottleneck acts as a multiplier on customer acquisition costs, a phenomenon often detailed in [industry research on operational efficiency](https://www.gartner.com/en/sales/insights/b2b-buying-journey).
Cross-functional teams are forced to absorb the impact of this structural misalignment. Sales cycles lengthen as representatives attempt to overcome emotional trust deficits, while customer success departments burn resources managing technical debt. By mapping these specific points of failure to operational metrics, organizations can finally stop guessing and start engineering predictable revenue models. We predict that companies failing to adopt this strict taxonomy will see their acquisition costs multiply as market tolerance for operational chaos drops to zero.
## Mid-Market B2B Challenges: Comparative Analysis
Mid-market B2B organizations face severe operational constraints, primarily driven by stagnant budgets, misaligned RevOps, and fragmented technology stacks. The biggest failure point occurs when teams attempt to scale pipeline velocity without resolving underlying structural deficits, leading to a measurable disconnect between marketing expenditure and actual revenue generation.
### Comparative Markdown Table: Mid-Market Challenges
| Structural Challenge | Surface-Level Symptom | Root Analytical Cause | High-Performing Team Resolution |
| :--- | :--- | :--- | :--- |
| **Budget Constraints** | "Do more with less" mandates | Linear scaling models applied to non-linear acquisition channels | Reallocating spend based on strict CAC-to-LTV ratio thresholds |
| **AI Integration Chaos** | Fragmented tool adoption | Deploying generative models without centralized data taxonomy | Standardizing inputs through a unified RevOps data architecture |
| **RevOps Alignment** | Disconnected sales/marketing metrics | Siloed telemetry tracking perceived vs. delivered value | Implementing shared pipeline velocity and retention KPIs |
To parse this table effectively, we must evaluate the statistical proxies that indicate systemic failure:
* **Capital Inefficiency:** Measured by a rising Customer Acquisition Cost (CAC) despite increased top-of-funnel lead volume.
* **Technological Entropy:** Quantified by the number of overlapping software licenses that fail to share a unified relational database.
* **Alignment Deficits:** Observed when marketing reports a positive ROI while sales pipeline velocity simultaneously decelerates.
### Budget Constraints vs. AI Chaos
The operational reality for mid-market B2B organizations is defined by a mathematical tension between stagnant capital and technological pressure. When leadership mandates efficiency, the default response is often rapid software procurement, directly resulting in mid-market B2B AI integration chaos. Instead of streamlining workflows, this fragmented adoption creates isolated data silos that actively degrade pipeline visibility.
Budget constraints are rarely a function of absolute capital scarcity. In our experience, they act as a statistical proxy for poor RevOps alignment, where marketing optimizes for top-of-funnel volume while sales is measured on closed-won revenue. High-performing teams reject this dichotomy. They understand that throwing budget at a structurally broken funnel only accelerates capital burn.
To drive pipeline with fewer resources, elite operators treat structural alignment as a prerequisite to scale. Rather than purchasing another point solution to mask operational friction, these organizations audit their existing telemetry. They accept the caveat that initial data centralization slows down execution in the short term, but yields a compounding mathematical advantage over time.
The organizations that survive the current market contraction will not be those with the largest budgets. They will be the entities that systematically map their internal operational bottlenecks and resolve them through strict, centralized data governance. The biggest competitive advantage is a clean database, not a complex algorithm.
## Perceived vs. Delivered Value Gap
The perceived vs. delivered value gap is the mathematical variance between what marketing promises and what a product actually executes. When sales claims exceed operational reality, this deficit directly accelerates churn. Closing this gap requires auditing product telemetry against marketing copy to ensure promises align with verifiable user outcomes.
### The Mathematics of Customer Churn
Over-promising is not a marketing strategy. It is a quantifiable operational failure.
When we analyze the statistical variance between what sales promises and what the product actually does, the resulting deficit is where Lifetime Value (LTV) goes to die. The relationship between Perceived vs. Delivered Value and Customer retention is strictly inverse; as the gap widens, retention collapses proportionally.
Buyers do not churn because a product lacks features. They churn because the mathematical equation of their purchase yields a negative return on expectations. Consider the mechanics of this deficit:
* **Perceived Value (PV):** The sum of all marketing claims, sales demos, and onboarding promises.
* **Delivered Value (DV):** The measurable, daily operational output extracted by the user.
* **The Churn Threshold:** When PV > DV for more than a standard billing cycle, the account is mathematically flagged for termination.
This is not an emotional response from the buyer. It is a cold, rational reallocation of capital away from an underperforming asset.
### Aligning Marketing Promises with Reality
Fixing this requires a formulaic approach to auditing marketing claims against raw product telemetry. You must measure the exact utilization rates of the specific features your sales team uses to close deals.
If a marketing campaign promises a reduction in reporting time, product telemetry must validate that users are actually generating reports faster. If the data shows users abandoning the reporting module after three clicks, your marketing is hallucinating.
To audit this alignment, implement a strict verification loop:
* **Extract Core Claims:** Isolate the top three value propositions used in your current ad copy.
* **Map to Telemetry:** Identify the specific product events that prove these claims are true.
* **Calculate the Variance:** Measure the percentage of active users who actually trigger these events weekly.
* **Adjust the Baseline:** Downgrade marketing claims until they match the 75th percentile of actual user outcomes.
In our experience, perfect alignment is impossible. Technical debt, legacy integrations, and user error will always create some friction. However, reducing the variance between the promise and the telemetry is the only sustainable method to stabilize retention. Stop selling imaginary futures. Start marketing the visceral, verifiable reality of your product.
## Founder Perspectives: Raw Market Frustrations
Founder feedback loops are systematic processes used to capture and analyze raw market frustrations directly from target buyers. By scraping unstructured community discussions, B2B leaders can identify the biggest operational bottlenecks. This empirical data prevents teams from building nice-to-have features and forces alignment with actual, validated customer pain points.
### Voice of the Customer: Unfiltered
When we analyze founder perspectives, a distinct pattern of hallucinated product-market fit emerges. To correct this, operators must directly confront raw market frustrations found in unfiltered community data.
Most B2B builders are engineering solutions for theoretical personas. They prioritize aesthetic, nice-to-have features while ignoring the visceral, operational chaos their actual users face daily.
The biggest failure mode in early-stage development is the inability to isolate problems actually worth solving. We observe this disconnect clearly when parsing unstructured qualitative data from platforms like Reddit.
* **The "Nice-to-Have" Trap:** "I built a predictive analytics dashboard, but my target accounts are still managing inventory in a corrupted Excel file. They don't care about my AI; they care about data loss."
* **The Value Disconnect:** "We are generating leads, but users churn after month one. The gap between what our marketing promised and what the product delivers is destroying our unit economics."
* **The Discovery Paralysis:** "How do you actually find pain points? I am analyzing competitor landing pages, but I cannot figure out what operational bottlenecks keep my buyers awake at night."
Reality bites. These qualitative signals represent the true baseline of market demand.
### Extracting Signal from Reddit Noise
Unstructured community forums are dense data reservoirs. However, reading threads manually is an inefficient method for extracting actionable intelligence. [Data-driven content strategies](https://www.mckinsey.com/capabilities/growth-marketing-and-sales/our-insights/the-b2b-growth-playbook) are essential for scaling this analysis.
To isolate genuine pain points, data scientists deploy systematic scraping protocols across niche subreddits and industry forums. The objective is to quantify the frequency of specific operational complaints. We categorize these text inputs using natural language processing to detect recurring negative sentiment around specific workflows.
If fifty mid-market operators complain about the exact same integration failure, that is a validated problem worth solving. It is not a subjective opinion. It is a statistical cluster.
Operators must filter out feature requests and focus exclusively on workflow breakdowns. Buyers rarely know what solution they need, but they are highly articulate about what is currently broken.
By mapping these unstructured complaints against your product roadmap, you force a mathematical alignment between your engineering output and the market's actual operational deficit. This empirical approach eliminates the guesswork from product marketing.
## Quantifying Emotional and Technical Friction
Measuring B2B friction requires translating subjective user complaints into quantifiable financial metrics. By assigning numerical weights to software latency and calculating churn probability from broken trust, organizations convert qualitative feedback into hard data. This mathematical approach directly links user frustration to customer acquisition costs and lifetime value degradation.
### Scoring Technical Debt in B2B
Unresolved **technical friction** inevitably cascades into severe **operational bottlenecks**. When an enterprise platform fails to sync data across departments, the resulting chaos is not a qualitative complaint. It is a measurable decay in workforce output.
Predictable.
To capture this reality, analytical teams must assign strict numerical weights to specific technical failures. In our experience, applying a severity index based on time-to-resolution provides an objective baseline.
* **Integration failures:** Weighted by the manual hours required to reconcile disparate databases.
* **Software latency:** Scored against the statistical drop-off rate in daily active usage.
* **Downtime events:** Calculated as a direct multiplier on pipeline velocity deceleration.
A high-severity integration failure directly correlates with a predictable spike in support ticket volume. This transforms a vague user annoyance into a hard operational cost. Founders often ignore these micro-frictions. Yet, aggregating these weighted scores reveals the true financial penalty of shipping half-baked features.
### The ROI of Emotional Relief
Emotional pain points are rarely treated as hard data. This is a structural error. Broken trust and slow response times are not soft metrics; they are leading indicators of account churn. Many founders are too lazy or fearful to measure emotional friction as a hard financial metric, preferring to hide behind vanity metrics like 'brand sentiment' while their churn rates climb.
When a user experiences a delayed support response, their perceived value of the software drops instantly. We can translate this emotional degradation into a strict churn probability metric. By mapping emotional triggers to historical cancellation data, data science teams can predict revenue leakage before it materializes.
* **Trust erosion:** Measured by the frequency of negative sentiment markers in communication logs.
* **Response anxiety:** Quantified by the time delta between ticket submission and first human contact.
Solving these specific frictions actively reduces Customer Acquisition Cost (CAC). Retaining an account through engineered emotional relief is mathematically cheaper than funding marketing campaigns to acquire a replacement. Every percentage point of churn prevented through emotional friction resolution directly lowers the blended CAC payback period.
Organizations that model emotional friction as a financial liability will systematically out-scale competitors who treat it as a customer service afterthought.
## Architecting The Data-Driven Solution
Systemic B2B marketing solutions require logical infrastructure rather than superficial copywriting adjustments. By deploying analytical engines that continuously measure product telemetry against marketing claims, mid-market organizations can permanently close the gap between perceived and delivered value. This structural alignment prevents operational friction and stabilizes customer retention at scale.
### Infrastructure for Pain Point Resolution
In our empirical analysis of mid-market operational models, the vast majority of marketing failures stem from structural deficits rather than messaging errors. Founders frequently attempt to solve systemic churn by rewriting landing pages. This is a mathematical fallacy.
Copywriting cannot fix a broken product experience. Logical infrastructure remains the only scalable cure for operational pain points. We consistently observe that companies relying on intuition over infrastructure experience a compounding disconnect between sales and product.
The fundamental issue is data latency. When a user encounters a workflow bottleneck, the delay between that event and the marketing team adjusting their acquisition strategy often spans months. This lag creates a prolonged window where the company continues to acquire users under false pretenses.
To build a resilient data architecture, organizations must implement specific operational layers:
* **Telemetry Synchronization:** Mapping user behavior directly to the initial marketing touchpoints.
* **Friction Quantification:** Assigning numerical severity scores to qualitative customer complaints.
* **Feedback Routing:** Bypassing manual interpretation to deliver raw data straight to product teams.
Without this architecture, the customer experience degrades while acquisition costs multiply.
### Automating Insights with HighStory.ai
Manual data extraction is inherently flawed. Human bias inevitably distorts the severity of user complaints, leading to misallocated engineering resources.
To achieve true HighStory.ai and RevOps alignment, companies require an analytical engine capable of processing unstructured feedback at scale. This integration forces marketing claims to synchronize with actual product telemetry.
Automated systems act as a strict governor on marketing promises. When the architecture detects a variance between what was sold and what is utilized, it flags the discrepancy before churn materializes.
This continuous feedback loop prevents the recurrence of the perceived versus delivered value gap. By removing the human element from data routing, organizations ensure that their marketing narrative remains tethered to reality.
While no technological deployment is entirely without implementation hurdles, automating these insights drastically reduces the margin for human error. Predictive models indicate that within the next operational cycle, manual churn analysis will become obsolete.
Companies that fail to automate this alignment will simply be priced out of their respective markets. The mathematical reality of B2B SaaS dictates that retention economics will always overpower acquisition volume.
## Deploying Your Pain Point Strategy
Deploying a B2B pain point strategy requires shifting from intuitive guessing to rigorous, data-driven friction measurement. Founders must systematically identify where operational bottlenecks occur, quantify the economic impact of these inefficiencies, and align their product capabilities directly with verified user struggles to eliminate the gap between marketing promises and actual product utility.
### Stop Hallucinating, Start Measuring
According to historical venture data, approximately 42% of failed startups attribute their demise to a lack of market need—a polite euphemism for building features for imaginary buyers. Most B2B founders are hallucinating problems to solve, designing elegant dashboards for theoretical personas while ignoring the visceral, operational chaos their actual users face daily. The true metric of marketing success is not lead volume, but how ruthlessly you can quantify and close the gap between perceived value and delivered value.
To build a high-performing engine, you must abandon intuition. Intuition is a liability in B2B marketing. Instead, map the exact friction points within your target accounts. This requires a systematic audit of user workflows rather than relying on superficial sales feedback.
* **Identify the friction points**: Track where users drop off or where manual workarounds are required.
* **Quantify the economic loss**: Calculate the exact cost of inaction for the prospect.
* **Isolate the biggest bottlenecks**: Focus resources only on solving the highest-impact operational failures.
### The Final Analytical Directive
Executing a sophisticated B2B Pain point marketing strategy requires more than static spreadsheets and subjective sales notes. HighStory.ai integrates directly into your RevOps stack to automate this exact pipeline, turning raw friction data into targeted narrative assets. By embedding this infrastructure, you replace guesswork with empirical evidence.
Stop guessing what your market needs. Integrate HighStory.ai into your RevOps stack today to systematically measure, target, and eliminate your buyers' biggest operational pain points. The market is shifting; either you quantify the friction, or you become the friction.
AI social media manager
A month of social media posts, ready to publish, in 2 minutes
HighStory reads your website and generates your Instagram, LinkedIn and Facebook posts with visuals, captions and a calendar. You approve, it publishes.